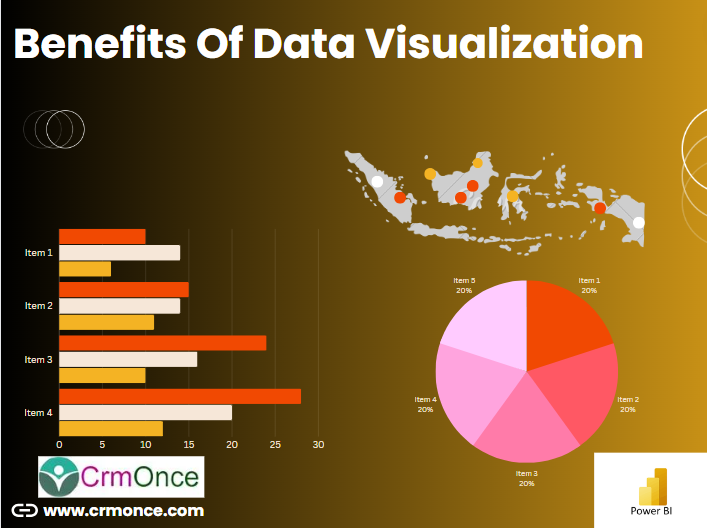
Benefits Of Data Visualization in power bi
Data visualization can be used in many contexts in nearly every field, like public policy, finance, marketing, retail, education, sports, history, and more.

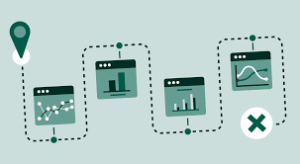
Here are the benefits of data: visualization
Storytelling: People are drawn to colors and patterns in clothing, arts and culture, architecture, and more. Data is no different—colors and patterns allow us to visualize the story within the data.

Accessibility:Information is shared in an accessible, easy-to-understand manner for a variety of audiences.

Visualize relationships:It’s easier to spot the relationships and patterns within a data set when the information is presented in a graph or chart.
Exploration:More accessible data means more opportunities to explore, collaborate, and inform actionable decisions.